S.G. Lee and S.W. Lye
School of Mechanical & Production Engineering, Nanyang Technological University, Republic of Singapore
Source:
International Journal of Physical Distribution & Logistics Management
ISSN: 0960-0035
Article publication date: 1 March 2003
Keywords: Packaging, Printed Paper Box, Rigid Paper Box, Design, Costs, Efficiency, Productivity
Abstract
Packaging costs (direct labor and material) account for a substantial portion of a product’s manufactured cost and so it is desirable to minimize these costs. And since major productivity gains have already been realised in manufacturing operations, the last frontier for productivity improvements appears to be in logistics. A formal methodology is therefore proposed to assess the efficiency of manual insertion and packing operations such as folding, insertion, labeling, sealing and scanning. Through this methodology, inefficient packaging operations can be identified and improved upon. This paper also discusses how standard manual handling and insertion times can be computed from raw data collected from industry. These standard manual handling and insertion times form the basis for the computation of the manual packaging efficiency expressed as a packaging index. The closer the index is to 1, the more efficient are the packaging operations. Tables of standard times for labelling, scanning barcodes, sealing with adhesive tape, and insertion into Zip-Locke bags and rigid paper boxes with two, three and four flaps are presented. A simple five-step procedure records the ideal and actual packaging times in a worksheet, from which the packaging efficiency may be computed. The methodology was applied to the packaging of mobile phones, hard disk drives, a desk-jet printer, a notebook computer, a video cassette recorder and a microwave oven. The packaging efficiencies of the three popular mobile phone models were computed to be 81.5 percent, 76 percent and 74.4 percent. By adopting the best packaging features of two competitor models, it was found that the packaging efficiency of one model of mobile phone could be improved by 13.7 percent. Arising from the research, the authors postulated a general manual packaging line consisting of all conceivable manual packaging operations. This generic manual packaging line is significant in a specific line for a specific product may be quickly configured from it. Finally, arising from the experience of the authors in this research, guidelines for the design of efficient packaging lines are proposed.
Introduction
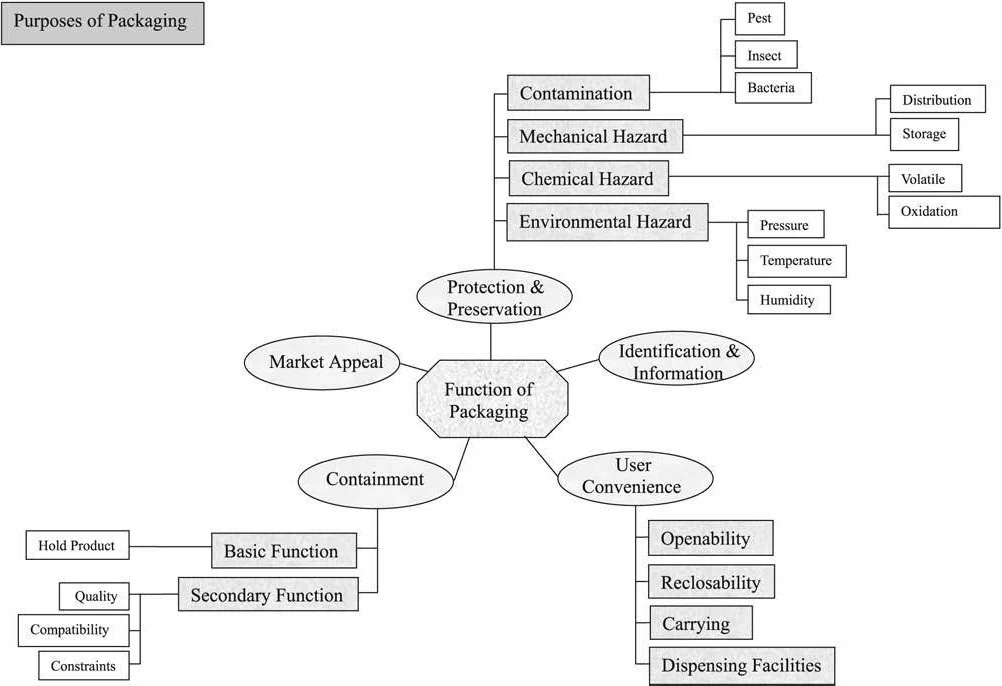
Product packaging is the science, art and technology of protecting products for the purposes of containment, protection, transportation/storage and information display. Figure 1 summarizes the five main functions of packaging. Three-quarters of all finished goods require packaging, with the food and drink industry making up 90 percent of that packaging market (Hanlon, 1984). As logistics is the last frontier for in-factory productivity improvement, attention is now focused on improving product packaging operations by minimizing the volume of material used and rationalizing the number and types of packaging operations (and therefore costs associated with equipment and labor).
Many factors impinge on manual packaging, such as the design of the packaging item, the nature of packaging materials used and their costs. Effective product packaging depends not only on the volume of material used and manpower, but on other factors such as packaging design. Over the last ten years, the authors have researched into expanded polystyrene protective packaging; the design of the protective buffer vis-a`-vis the product (Lye and Ho,1993; Lye and Yeong, 1994; Lye et al., 1997), fabrication processes (Lye et al.
1995, 1996; Lye and Yeong, 1996), computer-mediated packaging design (Lye and Lee, 1998, 1999; Lye and Chuchom, 1997) and, more recently, the re-cycling of expanded polystyrene foam buffers (Lye et al., 2002). The outcome of this research is design methodology to minimize waste and maximize in-factory profits. Sometimes, by changing the type of packaging, dramatic savings can be realized. For instance, Media Arts Group, a direct marketing company from San Jose, California, recently substituted paper pads around its painter frames with molded corners, thereby cutting down the number of workers needed from 21 to only three (Brody and Marsh, 1997). Space-saving protective packaging that provides the same level of protection often consume up to 85 percent less material and require less material handling effort (Hanlon, 1984).
There are as many packaging materials as there are packaging operations, as Figure 2 illustrates.
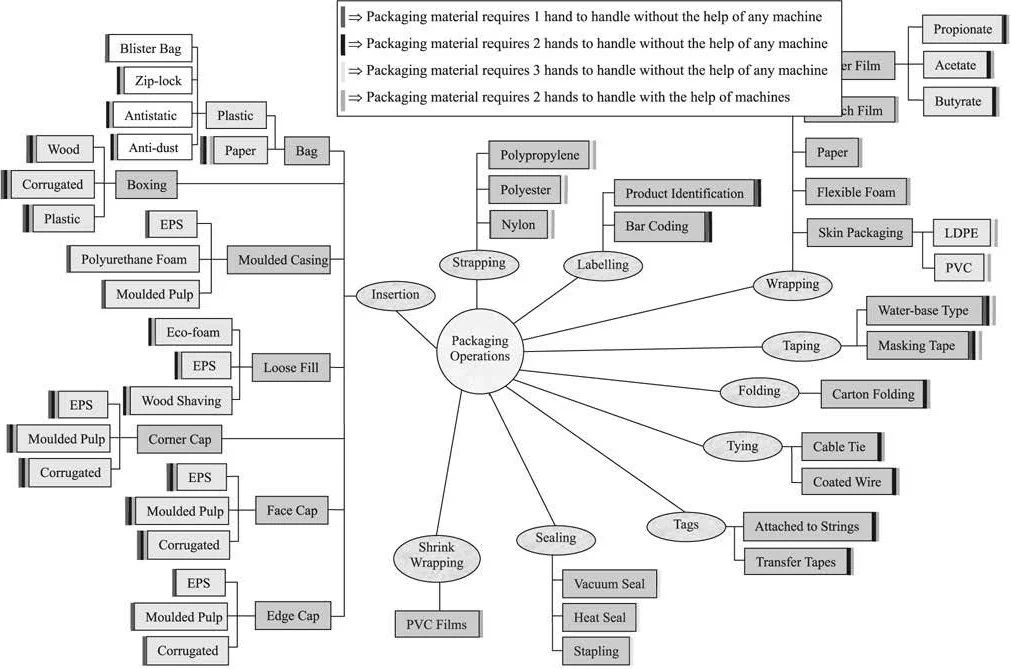
Table I shows the actual and forecast consumption of packaging materials in the USA (Rauch Associates, 2002). The figures do not include plastic food and garbage bags, fast-food packaging, re-conditioned barrels and drums, gas cylinders, tubes and cores and bulk containers. As can be seen, the major packaging materials are paper and paperboard, metals, plastics and glass, with plastics registering the highest likely increase. In fact, paper and paperboard packaging is used by more than 78 percent of all manufacturing industries. Wood is making a comeback as an environmentally acceptable packaging material. The major packaging plastics, polyethylene (PE), polypropylene (PP), polyvinyl chloride (PVC), polystyrene (PS), polyethylene terephthalate (PETE), polycarbonate (PC) and polyamide (PA), are transparent, flexible and have high tensile and impact strength (Hanlon, 1984). Often, plastics are reinforced with paper or aluminium foil to form a laminate. The value of industry shipments is about 2.2 percent of all US manufacturing, registering a 12.6 percent increase between 1996 and 2000, or an average of 3 percent per year. Consumer products account for 78 percent of the value of all packaging of which, food and beverages claims 55 percent. Industrial products account for the remaining 22 percent of total value.
The three major components of packaging costs are labor, equipment and material costs. In manual packaging, only labor and material costs are significant so a methodology to systematically compute labor and material costs is desirable. About 9 percent of the cost of any product is likely to be the cost of its packaging (La´szlo, 1990); about 90 percent of this cost of packaging may be attributed to factors other than the packaging material itself (Stern,1981). The manufacture, use and disposal of packaging accounts for up to about 60 percent of total production costs, or between 15-50 percent of the selling price of a product (Rauch Associates, 2002; Harckham, 1989; Briston and Neill, 1972). In addition, packaging materials constitute as much as 65 percent of the global solid waste, which underscores the need for packaging materials to be ecologically friendly (Brody and Marsh, 1997). Today, environmentally-responsible packaging manufacture is the responsibility of all stakeholders: raw material suppliers, packaging manufacturers and converters, users (fillers and packers) and traders (distributors, wholesalers and retailers) (Levy, 1993, 1999).
In present-day supply chain logistics, the influence of packaging is even more significant. A new methodology called “packaging scorecard” was developed to assess the overall packaging contributions of all partners in the supply chain (Jo¨nson, 2000). Tested on two different types of packaging systems for fast-moving consumer goods, it was found that retail made more efficient use of cardboard containers, while distribution was least efficient. Packaging is recognized as having a significant impact on the efficiency of the supply chain (Twede, 1992; Ebeling, 1990). However, packaging costs are often not considered or measured by logisticians or packaging designers (Twede, 1992). The same author found that the handling of packaging items strongly impacts the overall logistics cost of a grocery chain. For instance, ICA, Sweden’s largest grocery retail chain, claims that 75 percent of the total handling time in their retail chain occurs in the store and that is mainly due to packaging handling. The facts above underscore the need to quantify and minimise the time incurred for handling and other packaging operations through the whole distribution chain. Packaging and logistics should be more tightly integrated, at the same time as new packaging concepts and solutions that facilitate a more efficient handling are developed.
The objective of this paper is to introduce an objective, quantifiable performance metric to gage the effectiveness of packaging operations. Such a metric has the potential of improving factory productivity and rationalizing the entire supply chain. Many companies adopt a proven packaging design, but never get around to optimizing the type and volume of packaging used. The authors propose a “design for manual packaging” (DFPkg) methodology that is simple and easy to use and computes an index by which the effectiveness of different packaging operations may be compared.
| Material | 1996 | 2000 | 2005 | % D (2000-2005) | |
| Paperboard/molded pulp | 32.4 | 36.5 | 40.4 | 2.0 | |
| Metals | 16.2 | 16.4 | 16.7 | 0.3 | |
| Plastics | 18.6 | 22.6 | 27.2 | 3.8 | |
| Paper | 6.9 | 9.2 | 10.6 | 2.8 | |
| Glass | 4.5 | 4.1 | 4.2 | 0.5 | Table I. |
| Wood | 3.8 | 4.1 | 4.5 | 2.2 | Actual and forecast |
| Textile | 1.0 | 1.1 | 1.2 | 2.2 | shipments of the US |
| Total | 83.4 | 94.0 | 104.8 | 2.2 | packaging industry (in |
| Source: Rauch Associates (2002) | millions of dollars) |
Manual packaging
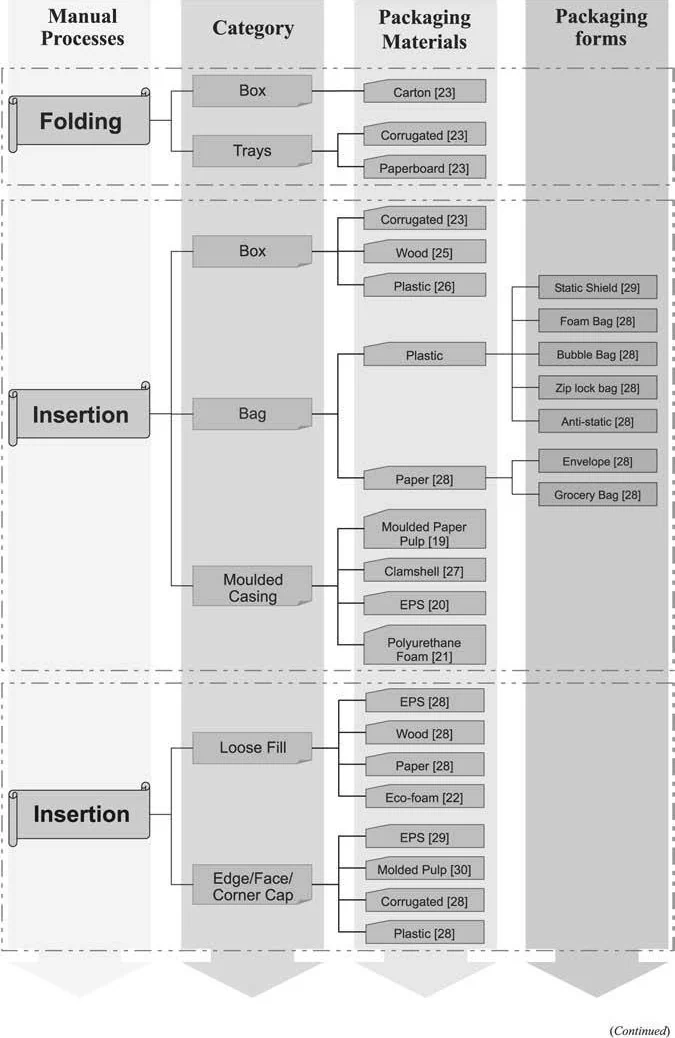
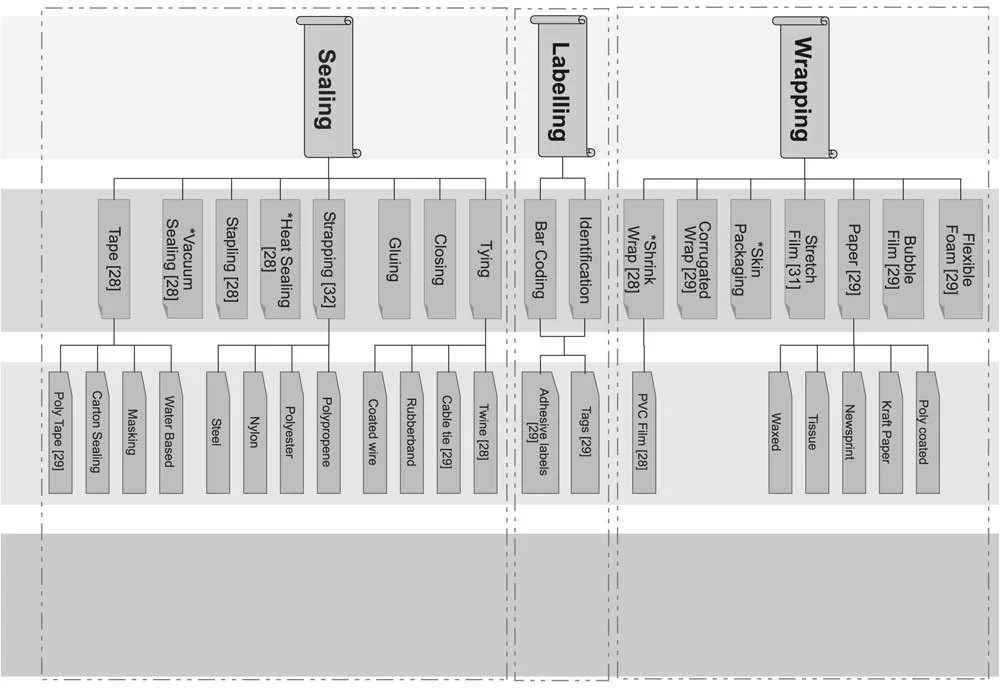
It is generally accepted that a manual packaging line comprises the basic packaging operations of folding, inserting, wrapping, sealing and labeling (La´szlo, 1990). The packaging is first folded from its collapsed form and then the product inserted into the folded package, which is then wrapped with a packaging sheet (which may be made of plastic, foam or paper) before it is sealed by tape, stapled or strapped. Finally, identification labels such as barcodes are either stuck or printed on. Figure 3 shows diagrammatically the various packaging materials and forms of packaging associated with each packaging operation.
Methodology for DFPkg
It is the experience of the authors that, despite the prevalence of packaging operations in industry, little research has focused on ways to improve their efficiencies. When one considers the quantum jumps in productivity gains in manufacturing, it appears that the last frontier of productivity improvement is in product packaging. Motivated by this, the authors propose a DFPkg methodology which has elements of design for the environment (DFEnv) (Paine, 1991) and design for assembly (DFA) (Hanlon, 1984; Boothroyd et al., 1994). By incorporating DFEnv, the authors acknowledge the potential impact of environmentally-hostile product packaging materials and practices. Since packaging operations are akin to part assembly, the basic principles of assembly can be applied to packaging, except that, because packaging is less intricate than parts assembly, the time expended for packaging is generally shorter than those for part assembly. Before we discuss the DFPkg methodology, it is important to first establish the standard times for the various packaging operations.
Standardizing the times of packaging operations
Since the authors were unable to locate any published data, they decided to measure the raw times and compute the standard times themselves. This was achieved through recording the times for skilled operators to perform the various packaging operations in manufacturing companies. For each packaging operation reported in this paper, the authors recorded 20 stopwatch readings and computed the simple mean. Where it was not possible to observe the packaging operations in situ, the packaging operations were replicated in the university, under conditions that closely resembled those
in industry. These controlled experiments accounted for about 15 percent of all packaging operations. The standard packaging times are then computed from the rating (or speed of working) of a skilled operator and all allowances associated with the job.
Rating
As the operator under observation may perform the tasks at a speed faster or slower than under normal circumstances, the time study analyst compares the performance (speed and tempo) of the subject under observation with his own perception of normal performance. Based on the performance rating system (Barnes, 1980), the rating of a single factor, be it operator speed, pace or tempo, may be expressed as a percentage of the normal performance which is set at 100 percent. A rating of 10 percent is the norm and this was the value adopted by the authors.
Normal time
The observed time multiplied by the rating yields the “normal” time. Thus: Normal time ¼ Observed time £ Rating. The normal time therefore is the time that a motivated, well-trained operator working at a steady pace takes to complete one cycle of an operation. When all allowances are factored into the normal time, we arrive at the standard time.
Allowances
Three general types of allowances (Barnes, 1980) are often considered:
- Personal allowance. Every worker must be allowed time for personal needs like going to the washroom, meal breaks, or even just to have a drink. For light work in an eight-hour working day without planned rest periods, 10 to 24 minutes a day is typical. For packaging, a 5 percent allowance is reasonable (Barnes, 1980).
- Fatigue allowance. Where the task is repetitive or strenuous or stressful, some allowance for recovery from fatigue is necessary. However, as packaging operations are not very physically demanding, the authors have chosen not to include a fatigue allowance (Barnes, 1980).
Delay allowance. Delays may be caused by interruptions such as material shortages or consultation with supervisors. Delays due to mishandling were also taken into account.
It will be appreciated that the values of the three allowances are by no means universal, being a matter of company policy. All three allowances are factored into the normal time to yield the standard time as follows:
Standard time 25% Normal time + (normal time allowance expressed as a percentage).
Standard manual handling and insertion times
The standard times for handling and inserting packaging items (such as Zip- Locke bags and two-, three- and four-flap paper boxes), as well as operations such as labelling, taping and scanning, can now be computed. The results are shown in Tables II-IX. A few explanations are in order:
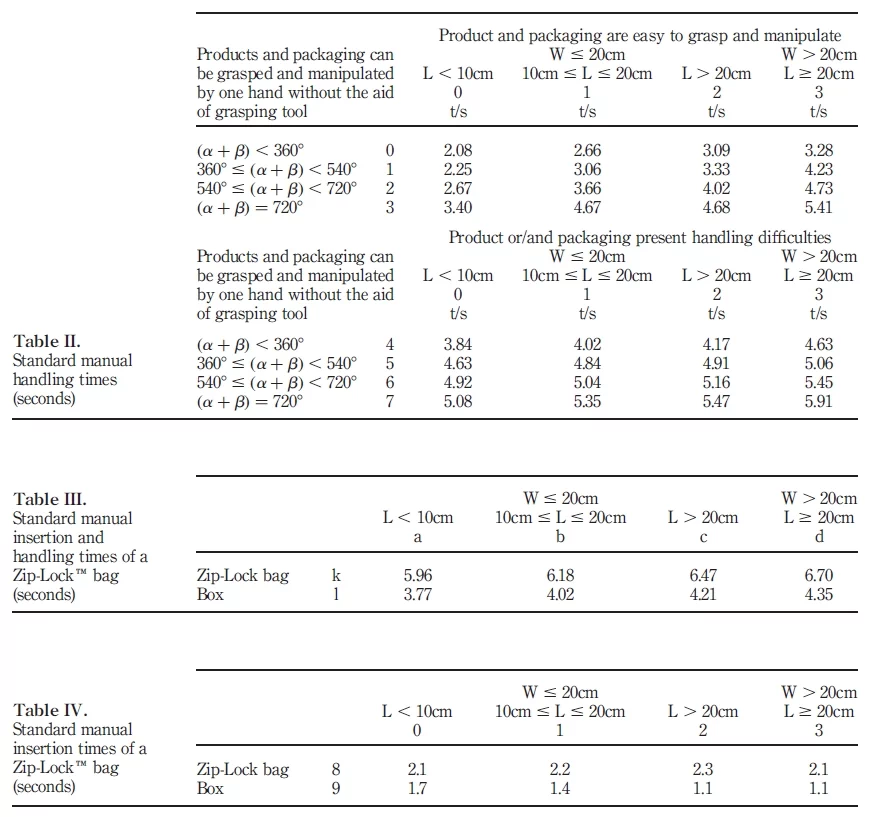
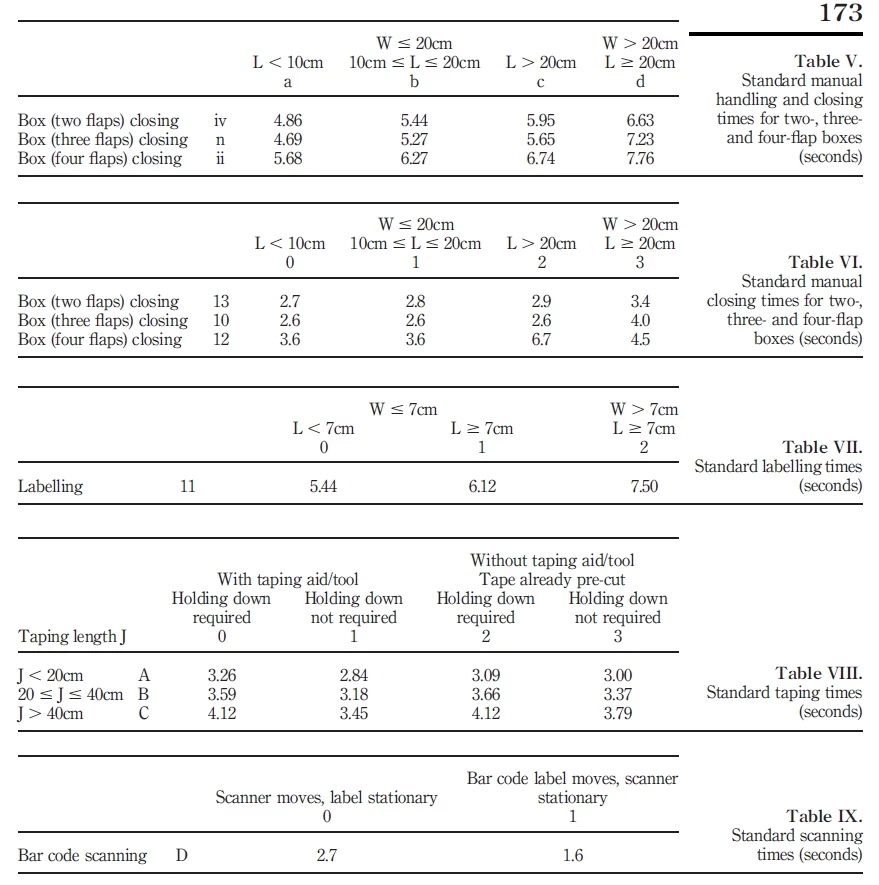
- L (length) refers to the longest side of the packaging and W (width) refers to the second longest side or another side with the same length.
- A human being can handle with two hands a maximum of 25kg (men) and 15kg (women). In order to avoid fatigue, a person should handle no more than 15 percent of the maximum weight in a repetitive working cycle (Brody and Marsh, 1997). Therefore, packaging which is heavier than 2kg is considered heavy for women workers
- Some packaging items such as plastic bags or greasy coatings are difficult to handle because they easily nest, tangle or stick together. Other packaging items that are fragile or delicate, or which have sharp corners or edges (i.e. metal straps), also need special handling.
- Handling aids refer to tools/mechanisms that are needed to hold the package/product in place in order to manipulate the package or pack the product (BSI 1133, 1991).
- The packaging materials may be inserted either horizontally or vertically. When inserting horizontally, packaging materials are inserted from either the left or right side of the product when the product is positioned flat on a surface. On the other hand, in vertical insertion, packaging materials are inserted from either the top or underneath of the product when the product is positioned the same way as when it is to be horizontally inserted.
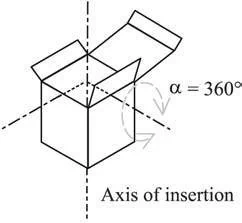
As a packaging item has to be oriented before use, it is first necessary to establish the rotational symmetry of the item, thus:
- a-symmetry is the rotational symmetry of an object about an axis perpendicular to the axis of insertion. For objects with a single axis of insertion, end-to-end orientation is necessary when a ¼ 3608, otherwise a ¼ 1808 (see Figure 4).
- b-symmetry is the rotational symmetry of an object about its axis of insertion; or equivalently about an axis which is perpendicular to the surface on which the object is placed during insertion. The magnitude of the rotational symmetry is the smallest angle through which the object can be rotated without altering its orientation. For instance, for a cylinder inserted into a circular hole, b ¼ 08; for an object with a square section inserted into a square hole, b ¼ 908.
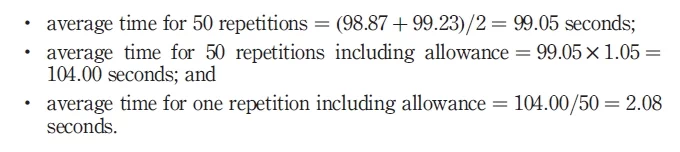
Thus, for example, the average manual handling time of a packaging item which is easy to handle and grasp, and measuring L , 10cm and ða þ bÞ , 608, i.e. (0,0) in Table II is computed as follows:
Manual packaging efficiency
Now that the standard manual packaging times have been established, the efficiency of manual packaging operations may be computed in five simple steps, using a worksheet such as the one shown in Figure 5:
- Identify the various items (parts) to be packaged and their corresponding packaging operations (i.e. handling or insertion).
- Look up the two-digit code of the packaging operation from Tables II-IX. This is the ideal packaging time (PTi ). Enter it in column 5.
- The ideal minimum number of packaging items (NM ) is entered in column 7. NM is a crucial factor in assessing the packaging efficiency because redundant packaging items add to costs. Guidelines have been proposed to assess if a packaging item is redundant (Levy, 1993).
- The product of column 7 (NM ) and column 5 (PTi) gives the actual packaging time (PTa) in column 6.
Finally, the manual packaging efficiency may be computed as follows:
Manual packaging efficiency
Now that the standard manual packaging times have been established, the efficiency of manual packaging operations may be computed in five simple steps, using a worksheet such as the one shown in Figure 5:
- Identify the various items (parts) to be packaged and their corresponding packaging operations (i.e. handling or insertion).
- Look up the two-digit code of the packaging operation from Tables II-IX. This is the ideal packaging time (PTi ). Enter it in column 5.
- The ideal minimum number of packaging items (NM ) is entered in column 7. NM is a crucial factor in assessing the packaging efficiency because redundant packaging items add to costs. Guidelines have been proposed to assess if a packaging item is redundant (Levy, 1993).
- The product of column 7 (NM ) and column 5 (PTi) gives the actual packaging time (PTa) in column 6.
- Finally, the manual packaging efficiency may be computed as follows:
Manual Packaging Efficiency ¼ PTi=PTa:
As the actual packaging time, PTa, is always longer than the ideal, PTi, the efficiency is less than 100 per cent. As the actual packaging time approaches the ideal time, the efficiency will be closer to unity.
Applications of the DFPkg methodology The DFPkg methodology was applied to the packaging of hard disk drives, mobile phones and four consumer products.
Hard disk drive
Hard disk drives are compact mass memory storage devices for computers that are packaged to protect them primarily from shock and vibration. Because of high volume production, even small gains in packaging efficiency can translate into significant cost savings. The sequence of packaging a hard disk drive is as follows:
- The hard disk drive is placed onto the conveyor system.
- A label is pasted onto the product and scanned.
- A protective plastic bag is retrieved from a container and slipped horizontally into the drive.
- A second label is peeled and pasted on the external surface of the protective plastic bag for lot identification and traceability purposes.
- The protective plastic bag is then tape sealed.
- Two polystyrene end caps are taken from a shelf and slipped horizontally onto the packaged drive.
- The packaged drive with the two end caps is then inserted vertically into a printed paper box, which is taken from a side tray. The paper printed box is then closed and sealed by tape. The packaging operation is now complete.
The DFP worksheet for the hard disk drive is shown in Figure 6. A brief explanation of the entries for each part follows:
The packaging efficiency was computed to be 85.1 percent, as shown in the worksheet of Figure 6. A quick glance at the entries of column 6 reveals that part ID no. 6 “protective cap” incurs the longest handling time of 11.06 seconds. If the handling of protective caps can be expedited either through the rationalisation of procedures or the application of special-purpose tools, the overall packaging efficiency can be improved further.
Mobile phones
The phenomenal surge in demand for mobile phones worldwide prompted the authors to investigate into the efficiency of their packaging operations. Like hard disk drives, small gains in packaging efficiency can translate into significant cost savings. The packaging of the following mobile phones were analysed: the Ericsson A, Ericsson B, Motorola Taiwan, Motorola B, Nokia A and Nokia B.
It is interesting to note that there is no standard type of packaging even for the same model of Motorola mobile phone because packaging decisions rest with the customer, namely the telecommunications operator, who bears the cost of packaging. Thus, the Motorola Taiwan model uses one polystyrene molded tray whereas the Thailand equivalent uses two trays. Furthermore, the primary packaging of accessories such as the charger, the adapter, the battery, and instructions manual are all out-sourced (except for the packaging of the hand set). As the authors had assumed that the primary packaging of some accessories such as the charger, the battery and the adapter were done in- house, the packaging efficiency is lower than expected. For instance, the packaging efficiency for the Singapore model is 0.760 whereas for Thailand’s it is 0.898. Furthermore, the cable tie was found to be superfluous as the charger comes inside a packaging paper box, while the Zip-Locke bag can be easily punctured by the sharp protrusions of the adapter. As the authors assumed that these two primary packaging operations were present in the actual line, the total packaging time increased by 10.58 seconds, thus reducing the packaging efficiency.
The ideal time to pack one unit of Ericsson’s mobile phone is 57.20 seconds, 61.53 seconds for Motorola and 60.28 seconds for Nokia. By industrial standards, these times are acceptable. The corresponding packaging efficiencies were computed as shown in Table X.
By adopting the best features of Ericsson and Motorola, the packaging efficiency of the Nokia A model can be improved as follows: maintain the size of the outer box, use one rather than two labels and one molded tray instead of two, and use a two-flap instead of a four-flap rigid paper box. If the above changes are made, the unit packaging time of the Nokia A decreases by 10.33 seconds, and its packaging efficiency improves by 0.137 or 13.7 percent.
Other manufactured products
Besides the hard disk drive and mobile phone, the packaging efficiencies of a few consumer products were also computed as shown in Table XI.
Although it is intuitive that the fewer the number of packaging items, the higher the packaging efficiency, Table XI shows the quantum of difference. Thus, the desk-jet printer has a lower the packaging efficiency than the microwave oven, say. On the other hand, the microwave oven and video cassette recorder, with the same number of parts, have similar packaging efficiencies. It can also be seen from Table XI that manual handling takes the longest time, compared to insertion and manual packing. This underscores the need to organise the presentation of packaging item and items to be packed in order to minimise the time for manual handling.
Some general recommendations
Arising from the collaboration with industry and the research undertaken, two major findings emerged:
- the formulation of a generic packaging line; and
- guidelines on the design of efficient packaging operations.
The notion of a general packaging line (GPL) It is not wishful thinking to conceive of a general packaging line consisting of all conceivable manual packaging operations. Such a line is a helpful aid in
packaging planning. A packaging line for a specific product can be quickly configured from knowledge of the essential packaging operations.
A generic manual packaging line comprises the packaging operations and items as shown in Figure 7, organized into primary, secondary and tertiary (transportation) sub-lines. These three sub-lines correspond to, broadly speaking, primary, secondary and tertiary packaging functions.
Sometimes, several primary packaging lines converge into one secondary packaging line. Take, for example, the packaging of a video cassette recorder (see Figure 8). The wires, remote control unit and the videocassette recorder itself are packed in the primary lines 1 through 3, before converging into the secondary packaging, a rigid paper box.
The manual packaging line of a Nokia model of mobile phone is as shown in Figure 9. The mobile phone comes with an instruction booklet and a warranty card, a battery and a charger. The packaging items comprise two polyethylene bags, two molded paper pulp trays, one outer corrugated printed box and one cable tie. The outer box designs are all the same. Mid-range and lower range phones are packed in the molded paper pulp tray and the outer box.
The manual packaging of a desk-jet printer, comprising accessories such as the printer cartridge, the power and USB cables, is next discussed. These four items may be packaged in four different ways, as shown in Table XII. The manual packaging line of option 1 is shown in Figure 10.
Guidelines for design for ease of packaging
The authors propose a set of guidelines to assist engineers in designing more effective packaging items and systems:
- Minimize the number and types of packaging items or packaging processes:
- For example, eliminate the number of sealing processes by designing parts with integral locking features, e.g. Zip-Locke bags.
- To assess if an existing or an additional packaging item is necessary, we ask “Is the packaging item distinct from all other items, otherwise it will be extremely difficult or even impossible to unpack?” If the packaging item need not be distinct from others, then it can be integrated with the others into a single package.
- Is the packaging “over-designed”? If an existing or additional packaging item does not add value to the packaging function, then it is redundant and can be eliminated.
- Ensure ease of handling of packaging from bulk. Use appropriate dispensers to handle flexible packaging material such as blister wrap (Jo¨nson, 2000).
- Minimize the need for re-orientation during packaging. Orientate the packaging material in the same direction as required by the packaging operation.
- Ensure that a packaging operation cannot be undertaken incorrectly. The orientations of packaging materials should be unambiguous and clearly marked, e.g. the active face of anti-static wrap.
- Maximize the symmetry of a packaging item or make it obviously asymmetrical. Use a packaging paper box with a rectangular opening for a product with a rectangular cross-section.
- Avoid wrapping products with protrusions or sharp corners or inserting them into bags:
- Sharp corners tend to puncture or tear the packaging.
- The sharp corners and protrusions usually tangle with the bag during insertion, thus making packaging difficult.
- Avoid using flexible packaging which is difficult to handle and therefore take a longer time:
- Shrink wrap tends to stick together.
- Use substitutes whenever possible.
- Use lightweight packaging whenever possible. Use cardboard gift boxes instead of wooden crates thereby saving transportation costs.
- Package products in bulk and in larger quantities. By so doing, the volume of packaging material saved can be considerable.
Guidelines for design for ease of packaging
The authors propose a set of guidelines to assist engineers in designing more effective packaging items and systems:
- Minimize the number and types of packaging items or packaging processes:
- For example, eliminate the number of sealing processes by designing parts with integral locking features, e.g. Zip-Locke bags.
- To assess if an existing or an additional packaging item is necessary, we ask “Is the packaging item distinct from all other items, otherwise it will be extremely difficult or even impossible to unpack?” If the packaging item need not be distinct from others, then it can be integrated with the others into a single package.
- Is the packaging “over-designed”? If an existing or additional packaging item does not add value to the packaging function, then it is redundant and can be eliminated.
- Ensure ease of handling of packaging from bulk. Use appropriate dispensers to handle flexible packaging material such as blister wrap (Jo¨nson, 2000).
- Minimize the need for re-orientation during packaging. Orientate the packaging material in the same direction as required by the packaging operation.
Conclusion
This paper presents a methodology to assess the effectiveness of manual packaging operations such as folding, insertion, labeling, sealing and scanning. Manual handling and insertion standard times were computed from raw data collected from industry. These standard times form the basis for the computation of a manual packaging efficiency index, which compares the ideal to the actual manual packaging times. The closer the index is to unity, the more efficient are the packaging operations.
The methodology was applied to the packaging of mobile phones, hard disk drives, a desk-jet printer, a notebook computer, a video cassette recorder and a microwave oven. The case study of the hard disk drive illustrates the ability of the methodology to identify packaging operations that take a long time. The three mobile phone models, on the other hand, illustrate how the best packaging features of similar products may be adopted to improve packaging efficiency. It was found that the packaging efficiency of one model of mobile phone can be improved by 13.7 percent if only one label and one molded tray were used, and a two-flap box were used instead of a four-flap one. Arising from the research, the authors postulated a general packaging line consisting of all conceivable manual packaging operations from which a specific line for a specific product may be quickly configured. Finally, guidelines for the design of efficient packaging lines are proposed.
References
Barnes, R.M. (1980), Motion and Time Study, Design and Measurement of Work, John Wiley & Sons, New York, NY.
Boothroyd, G., Dewhurst, P. and Knight, W. (1994), Product Design for Manufacture and Assembly, Marcel Dekker, New York, NY, Chapter 3.
Briston, J.H. and Neill, T.J. (1972), Packaging Management, Pentagon Bureau/Biddles, London/Guildford.
Brody, A.L. and Marsh, K.S. (1997), The Wiley Encyclopedia of Packaging Technology, 2nd ed., John Wiley & Sons, Inc., New York, NY.
BS 1133 (1991), Packaging Code: Section 4, Mechanical Aids in Packaging Handling, British Standard (BSI Standards), clause 2.
Ebeling, C. (1990), Integrated Packaging Systems for Transportation and Distribution, Marcel Dekker, New York, NY. Hanlon, J.F. (1984), Handbook of Package Engineering, 2nd ed., McGraw-Hill, New York, NY.
Harckham, A.W. (1989), PDC: Packaging Strategy, Meeting the Challenge of Changing Times, Technomic Publishing Co., Lancaster, Chapter 2.
Jonson, G., Johnsson, M. and Bja¨rnemo, R. (2000), “Packaging logistics – evaluation methods for increased efficiency in the supply chain”, Proceedings of the International Conference on Computer Integrated Manufacturing (ICCIM 2000), Volume 1, pp. 185-197.
La´szlo, R. (1990), Packaging Design: An Introduction to the Art of Packaging, Van Nostrand Reinhold, New York, NY.
Levy, G.M. (1993), Packaging in the Environment, Blackie Academic & Professional, New York, NY. Levy, G.M. (1999), Packaging, Policy and the Environment, Aspen Publishers, Inc., New York, NY.
Lye, S.W. and Chuchom, S. (1997), “A neural predictive model for characterising impact cushioning curves”, Journal of Engineering Applications of Artificial Intelligence, Vol. 10 No. 6, pp. 639-46.
Lye, S.W. and Ho, H.K. (1993), “Automated CAD protective packaging”, International Journal of Engineering with Computers, Vol. 9 No. 3, pp. 178-86.
Lye, S.W. and Lee, S.G. (1998), “A parametric study of the shock characteristics of expandable polystyrene foam protective packaging”, Journal of Polymer Engineering and Science, Vol. 38 No. 4, pp. 558-65.
Lye, S.W. and Lee, S.G. (1999), “Redesigning protective packaging buffers from the failure modes derived from crack characteristics”, Journal of Applied Polymer Science, Vol. 72, pp. 721-31.
Lye, S.W. and Yeong, H.Y. (1994), “An integrated framework for protective packaging design and manufacture”, International Journal of Production Research, Vol. 32 No. 8, pp. 1837-56.
Lye, S.W. and Yeong, H.Y. (1996), ““Associativity modelling of 3-D mould design of expandable polystrene products””, International Journal of Production Research, Vol. 34 No. 4, pp. 1161-70.
Lye, S.W., Yeong, H.Y. and Lee, S.G. (1995), “A front end process planner for the machining of moulds for expanded polystyrene protective packaging”, International Journal of Computer Applications in Technology, Vol. 8 No. 5, pp. 365-75.
Lye, S.W., Yeong, H.Y. and Lee, S.G. (1996), “An investigation into rapid prototyping of moulds for expanded polystyrene foam”, International Journal of Advanced Manufacturing Technology, Vol. 12, pp. 87-92.
Lye, S.W., Chuchom, S. and Lee, S.G. (1997), “The distributive area ratio in determining of protective packaging design configuration”, International Journal of Production Research, Vol. 35 No. 10, pp. 2713-21.
Lye, S.W., Aw, H.S. and Lee, S.G. (2002), “Adhesives for bead fusion of recycled expandable polystyrene”, Journal of Applied Polymer Science.
Paine, F.A. (1991), The Packaging User’s Handbook, Blackie, New York, NY/Glasgow.
Rauch Associates (2002), The Rauch Guide to the US Packaging Industry, 2002-2003, Rauch Associates, Bridgewater, NJ.
Stern, W. (1981), Handbook of Package Design Research, John Wiley & Sons, Inc., New York, NY. Twede, D. (1992), “The process of logistical packaging innovation”, Journal of Business Logistics, Vol. 13 No. 1, pp. 69-94.
Citation
Lee, S.G. and Lye, S.W. (2003), “Design for manual packaging”, International Journal of Physical Distribution & Logistics Management, Vol. 33 No. 2, pp. 163-189. https://doi.org/10.1108/09600030310469162